Evaluating the Predictability of Win Percentage with Point Differential in the 2019 NFL Season
Is point differential a better indication of a team's quality than win percentage?
This is the second article in an ongoing series where I take data from the 2019 season and conclude which variables affected NFL franchises the most, as well as other forms of analysis.
Click here for all other articles in the series

In most sports, including the NFL, pundits, and analysts, generally cite point differential or score differential as a note-worthy metric for evaluating the strength of a team. As a result, I decided to statistically evaluate the relationship between point differential and win percentage in the 2019 NFL season.
Background
Defining Point Differential
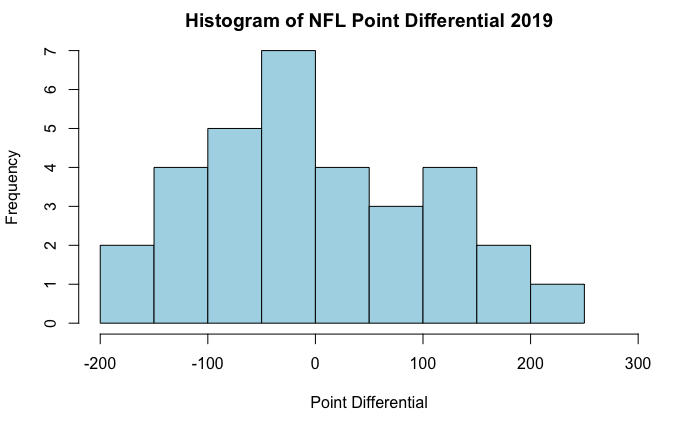
Point differential is the total sum of the margin of victory or margin of loss throughout an entire season. As expected the center is about zero, and the distribution appears to be approximately normal (or perhaps slightly skewed right).
Defining Win Percentage
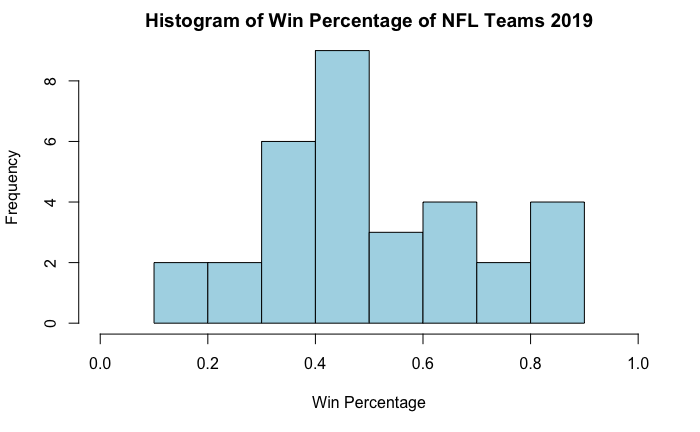
As previously mentioned in my article “Does Strength of Schedule Impact Win Percentage in the NFL?”, win percentage is the proportion, in a decimal format, of games an NFL team won during the 2019 regular-season. The distribution is typically approximately normal, symmetric, and centered around 0.5 as seen in the histogram.
Creating a linear model
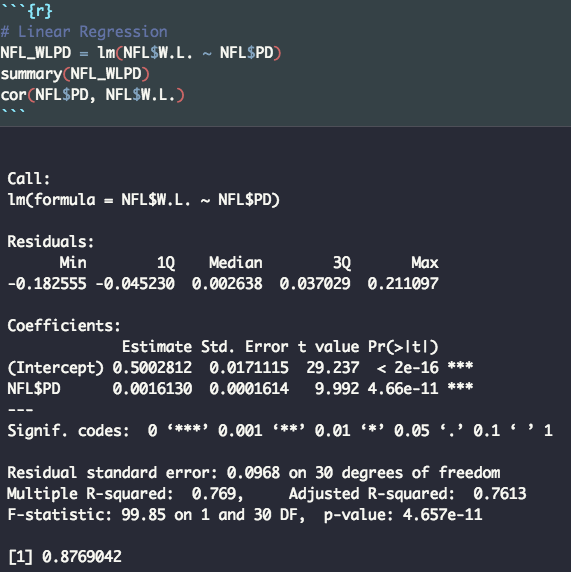
As seen above the linear model was created in R with Point Differential v.s. Win Percentage
Our linear model: ŷ = 0.001613x + 0.50028
ŷ is the model’s predicted win percentage
x is a team’s point differential
Accuracy of the model
The ŷ-intercept output (0, 0.5) makes sense because if a team scores the same amount of points as it gives up, most fans would expect them to win roughly half of their games. Moreover, the previous explanation supports why the p-value (the probability of the results being due solely to random chance) for the intercept is essentially zero.
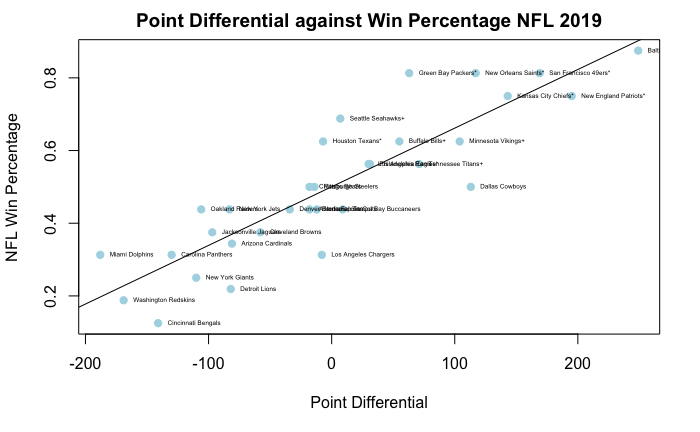
The correlation coefficient also makes intuitive sense because as a team’s point differential increase most people would think that team would have won more games. Additionally, the high r (correlation coefficient) of 0.877 should be expected based on the scatter plot because the regression line seems to be fairly close to most of the data points.
Side Note: A logistic model could have also worked for this regression model. Not only does the data look more logistic when plotted without the names and the regression line, when thought intuitively if a team has an increase in their season point differential from 0 to 100 that should predict more wins than an increase from 150 to 250 because wins should be harder to amass when a team has already won many games.
Significance Test
To see if the coefficient of point differential, or the slope of the regression line, is statistically significant, a t-test is performed against the null of a coefficient of zero (similar tests are performed for the intercept). As seen in the computer output, despite an extremely shallow slope of 0.0016 there was an extremely small p-value of 4.6*10^-11, which is approximately zero: this output should occur based on the accuracy of the regression line when graphed with the data points. In terms of the dichotomy of a shallow slope and a low p-value, the slope of a linear model has no association with the accuracy of the model. Additionally, logically speaking, when predicting a team’s win percentage, a number that ranges from 0 to 1, from point differential, which ranges from -188 to 249 in 2019, the slope will naturally be close to zero due to the units of the two variables.
Residual Plot
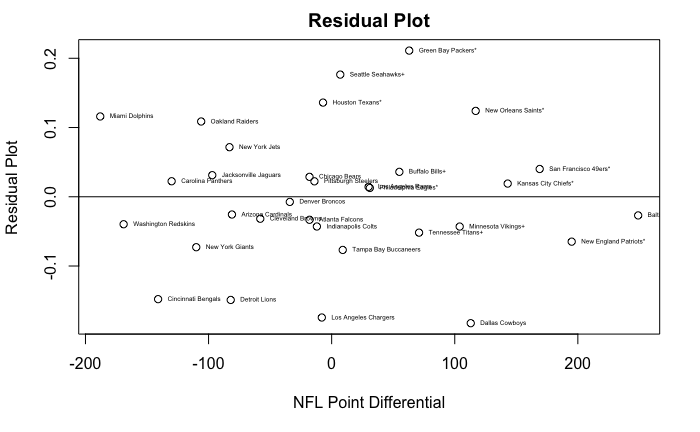
What is a residual plot?
A residual plot is a graph of the difference between the actual and the predicted.
Example:
The Philadelphia Eagles’ point differential for 2019 = 31
The Eagles’ actual winning percentage for 2019 = 0.563
The predicted Eagles’ win percentage for 2019 using the model
0.001613(31) +0.50028 = 0.550
The residual for the Eagles is 0.563–0.550 = 0.013
As seen above there appears to be random scatter above and below zero, suggesting that a linear model, despite my hypothesis of a logarithmic model being better, is probably the best model type.
However, the residual plot does highlights areas where the model needs work. If I had more time, I would rework the model to get rid of garbage time points, which I would define as points for and against a team when one team is leading or trailing by more than 17 points in the fourth quarter. This would certainly fix teams that had massive residuals, in terms of their distance from zero, like the Dallas Cowboys, who would light up the scoreboard against lesser competition but struggle to score touchdowns against teams above 0.500.
Furthermore, the residual plot reveals the problems with using point differential to predict a team’s win percentage. Teams whose style of play is prone to close games, for instance, the Seahawks, are severely undervalued by the model.
Final Thoughts
Is point differential a perfect interpretation of the strength of a team and their win percentage? No. Nevertheless, it is one of, if not, the best counting statistic that can represent the quality of a team.
Follow us on Twitter @flyphillyfly2
All data was via Pro Football Reference
All calculations, models, and graphs were produced using R (Studio).
Featured photo from KeithJJ — Pixabay