Does Strength of Schedule Impact Win Percentage in the NFL?
Is any given Sunday true?

This is the first article in an ongoing series where I take data from the 2019 season and conclude which variables affected NFL franchises the most, as well as other forms of analysis.
Click here for all other articles in the series
It seems as though the conclusion of the 2019 NFL season happened a millennium ago. Numerous teams surpassed expectations and many others fell far short of them. My Philadelphia Eagles turned around a disastrous, injury-riddled start and rallied around each other to gain a playoff berth. However, numerous experts declared that the Eagles’ schedule was the sole reason why they made it into the dance.
This common belief throughout the national sports media leads to today’s question: was there a correlation between a team’s strength of schedule (SoS) and their win percentage in the 2019 NFL regular season?
Background
What is the “Strength of Schedule” statistics?
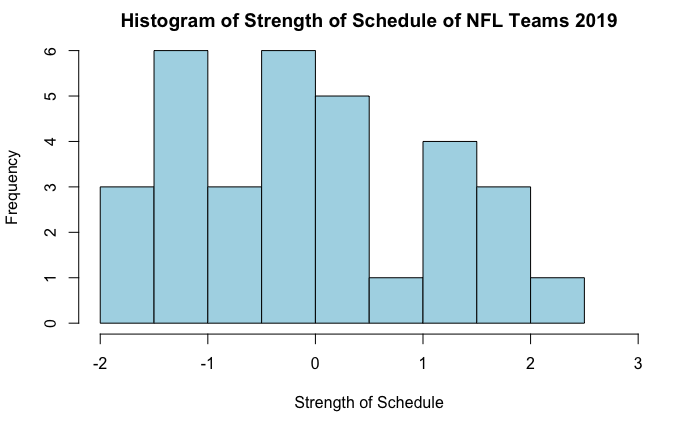
SoS is a value that represents the difficulty of an NFL team’s schedule in the regular season. This number is calculated using the Simple Rating System (SRS) which is a metric that measures the quality of a team. Both SoS and SRS are calculated by Pro Football Reference. The distribution of SoS is typically centered around zero and teams with negative values have easier schedules and teams with positive values have a more difficult schedule. It is assumed to be approximately normal and symmetric but as seen in the histogram that does not appear to be the case for 2019. I will assume normality for future applications.
Defining Win Percentage
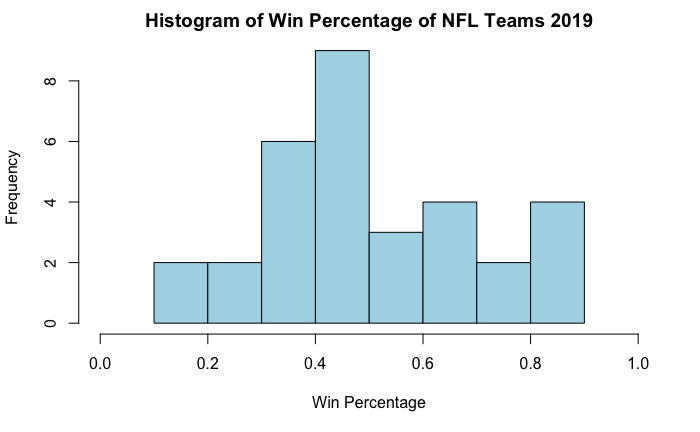
Win percentage is the proportion, in a decimal format, of games an NFL team won during the 2019 regular-season. The distribution is typically approximately normal, symmetric, and centered around 0.5 as seen in the histogram.
Creating a linear Model
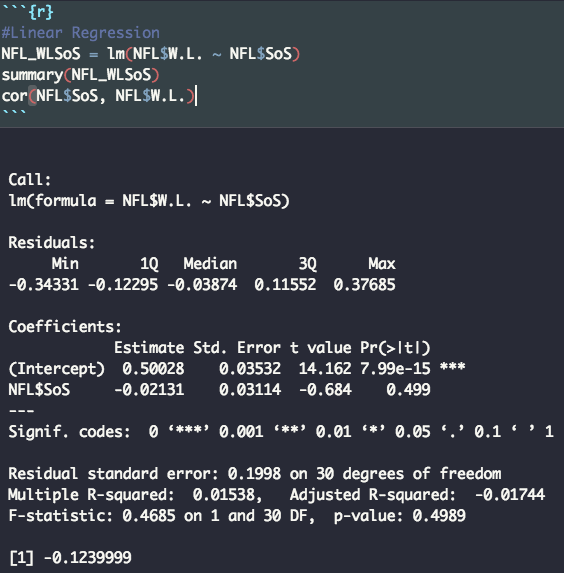
As seen above the linear model was created in R with SOS v.s. Win Percentage.
Our linear model
ŷ = -0.02131x +0.50028
ŷ is the model’s predicted win percentage
x is a team’s SoS
Accuracy of the Model
The ŷ-intercept output (0, 0.5) makes logical sense. If a team has a perfectly balanced schedule (a zero SoS value), that team should win approximately 50% of their games. However, the fact that the slope and the correlation coefficient (-0.124), which measures the linear dependence of a variable, are extremely close to zero demonstrates that most likely for the 2019 NFL season SoS had a minor, if not negligible, effect on win percentage.
Significant Test
Moreover, when performing a t-slope significance test against the null of a slope of zero or no correlation, the p-value (the probability of these results happening by chance or “luck”) was 0.4989. Thus, we can conclude that since the p-value (0.4989) is greater than alpha = 0.05 (the probability of a type one error), we fail to reject the null hypothesis. At alpha = 0.05 there is no significant evidence that there is a linear relationship between the strength of schedule and the win percentage of an NFL team in 2019. However, these calculations provide some evidence to the motto “any given Sunday” because the lack of evidence for a linear relationship suggests that perhaps upsets occur frequently in the NFL.
Residual Plot
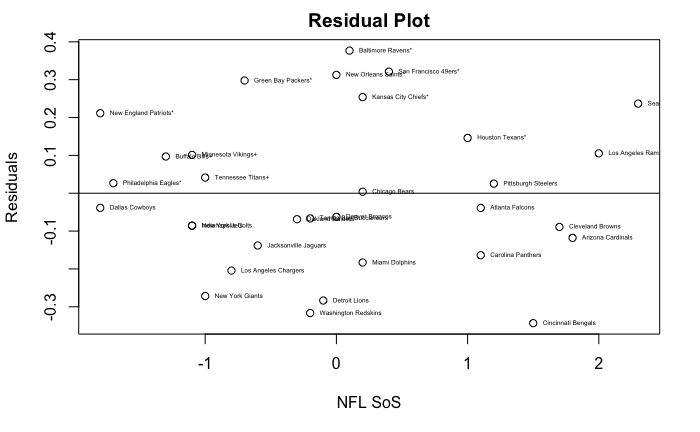
What is a residual plot?
A residual plot is a graph of the difference between the actual and the predicted.
Example:
The Philadelphia Eagles’ SoS for 2019 = -1.7
The Eagles’ actual winning percentage for 2019 = 0.563
The predicted Eagles’ win percentage for 2019 using the model
-0.02131(-1.7) + 0.5 = 0.537
The residual for the Eagles is 0.563 – 0.537 = 0.026
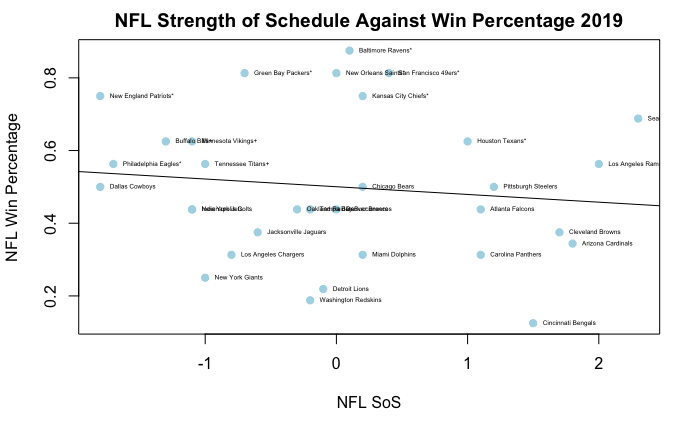
Despite the fact that there does not appear to be a linear relationship between the two variables, there seems to be random scatter in the residual plot, which typically implies that a linear model is most appropriate. Moreover, random scatter with insignificant linear model results (based on the significance test) hints at the fact that there may well be an extremely weak if not no relationship between win percentage and a team’s schedule.
Another intriguing observation is that for teams that had win percentages around 0.500 (i.e. teams like the Steelers and Bears) the model is fairly accurate.
Final Thoughts
The data suggest that if a team is elite, a difficult schedule will not deter that team from having a successful season. Similarly, if a bottom of a barrel team has an easy schedule that will not result in them having a successful season. Thus, although numerous analysts and pundits declare that “X” team made the playoffs because of a weak schedule, in general, because of the disparity in the NFL, the strength of a team’s schedule is not significantly associated with that franchise’s win percentage, or at least in the 2019 NFL season.
Hence, even though the Philadelphia Eagles had to win four games against subpar teams in 2019 to advance into the playoffs, due to the upset-prone nature of the NFL they unquestionably earned their spot.
FLY EAGLES FLY!
Follow us on Twitter @flyphillyfly2
All data was via Pro Football Reference
All calculations, models, and graphs were produced using R (Studio).
Featured photo from Evan Brockett on Unsplash